








.jpg)




According to the official NSI release dated 24.06.2026, in the 1st quarter of 2026 Bulgaria’s house price index rose 6.2% quarter on quarter and 14.8% year on year. This is an index of price change in registered household transactions — not an average price per m² and not a forecast of further market moves.
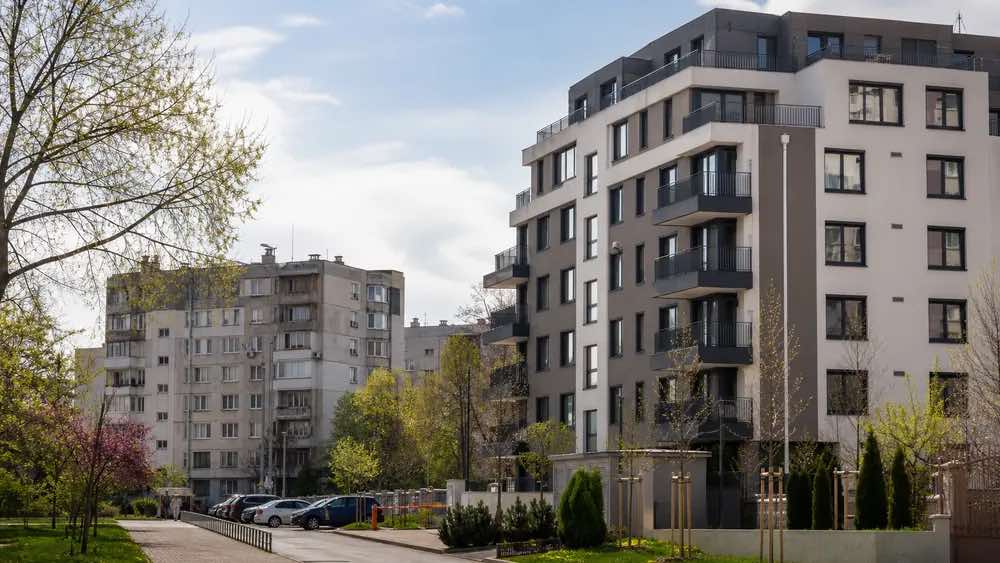
City quarterly figures published by NSI: Burgas +5.9%, Sofia +5.8%, Varna +4.0%, Plovdiv +3.9%. Official statistics separate measurable price change from listing prices and from private forecasts.
Price trends by city and property type
| City | Total | New dwellings | Existing |
| Sofia | 16.0% | 16.2% | 15.8% |
| Plovdiv | 8.8% | 1.9% | 15.2% |
| Varna | 13.2% | 4.5% | 17.0% |
| Burgas | 17.7% | 25.8% | 13.0% |
NSI calculates each city’s overall figure as a standalone index, not a simple average of new and existing segments. A city-wide percentage cannot be applied to a single flat: the index does not state the reason for the change, the stage of a given development, Act 16 status, or unit liquidity.

Market expectations at the start of 2026
In January 2026, BTA reported an analyst’s view of a 5–10% rise nationwide and 8–12% in Sofia. This is an attributed market forecast, not NSI data and not a confirmed official outcome. An annual forecast and a 1st-quarter year-on-year index are not directly comparable: different horizons, methods and measurement objects.
A practical next step is to fix the city and purchase goal, then compare only truly similar units. Used this way, official statistics help you ask better questions without becoming a promise of future growth.