








.jpg)




Updated on 10 August 2026. The 2018 market baseline is retained as a clearly dated archive. Before using an old figure in a purchase decision, compare properties in the same city and of the same type and condition, using figures recorded on the same date. Then verify the specific property and consult the latest official index.
A figure from 2018 can still answer a historical question: how quickly was the housing price index changing at that point? It cannot tell you what one specific apartment or house should cost now.
This page keeps the early baseline without turning it into a current price list. It then shows how to compare live offers and check the exact property.
What the 2018 baseline can and cannot tell you
The earlier article mixed market movement with examples from property listings. These are different types of evidence. A house price index measures change in a defined statistical series. A listing records an asking price for one object at one time. Neither is an automatic valuation of another property.
Historical index data is useful for understanding the 2018 context. The old minimum prices are reproduced below as dated statements from the page, while the underlying listing sample remains unavailable for a reliable comparison. Property segment and location also remain as fields for a new comparison.
Archive rule: every percentage in the next two tables belongs to the year stated in its heading and compares that quarter with the corresponding quarter of the previous year. These figures are not current offers, average prices per square metre or forecasts.
Archive: official quarterly house price index for 2017
This historical table records annual changes in Bulgaria's house price index for each quarter of 2017 compared with the corresponding quarter of 2016. It is retained only as a dated archive and must not be read as a current price list.
| 2017 HPI series | Q1 vs Q1 2016 | Q2 vs Q2 2016 | Q3 vs Q3 2016 | Q4 vs Q4 2016 |
|---|---|---|---|---|
| Total | +9.0% | +8.6% | +9.0% | +8.2% |
| New dwellings | +9.4% | +7.3% | +5.5% | +4.7% |
| Existing dwellings | +8.8% | +9.2% | +10.9% | +10.0% |
Archive: official quarterly house price index for 2018

The table preserves the quarterly year-on-year changes for Bulgaria's house price index in 2018. The figures are attributed to the National Statistical Institute and Eurostat. Use the official links in the sources section to confirm the series, period and any later revisions.
| 2018 HPI series | Q1 vs Q1 2017 | Q2 vs Q2 2017 | Q3 vs Q3 2017 | Q4 vs Q4 2017 |
|---|---|---|---|---|
| Total | +7.1% | +7.5% | +6.3% | +5.5% |
| New dwellings | +2.3% | +7.2% | +7.2% | +6.1% |
| Existing dwellings | +9.7% | +7.7% | +5.8% | +5.3% |
The table describes percentage change in a national index. It does not state the price of a studio in Sunny Beach, a house near the coast or an apartment in Varna. The site's 2016 and 2017 market review remains available for the preceding historical context.
Archive: asking prices printed on 22 November 2018
The two tables reproduce the labels and figures printed by the original page. The page did not retain the listing sample or calculation method. They are dated asking-price and price-per-square-metre examples, not current offers, completed transactions or a reliable average for another property.
| Segment | Price printed on the page | Price per m² printed on the page |
|---|---|---|
| Studio | From €7,770 | €350 |
| One-bedroom apartment | From €15,000 | €500 |
| Two-bedroom apartment | From €18,400 | €500 |
| Four-room apartment | From €40,000 | €850 |
| House on the coast | From €48,000 | €650 |
| Property by the sea | €15,000 | €600 |
| Mountain property | €7,770 | €310 |
| Location | Price per m² printed on the page |
|---|---|
| Varna | From €660 |
| Burgas | From €430 |
| Sunny Beach | From €300 |
| Sveti Vlas | From €450 |
| Sozopol | From €600 |
Market explanations recorded by the 2018 article
The page described 2016 to 2018 as a period of recovery after the earlier crisis. It reported annual growth of 7% to 10% over that period and 10% to 15% in large cities; it repeated ranges of 7% to 10% for the first three quarters of 2018 and 10% to 15% for Sofia, Varna and Burgas. It linked demand to economic growth, low mortgage rates and limited supply of quality housing, and reported buyers from Germany, the United Kingdom, Israel, Russia and other CIS countries. The article expected growth to continue in 2019 and 2020. These were dated ranges, explanations and a forecast from the 2018 article, not verified current drivers or expectations; the official HPI tables above remain a separate series.
Keep the old segments, rebuild the figures
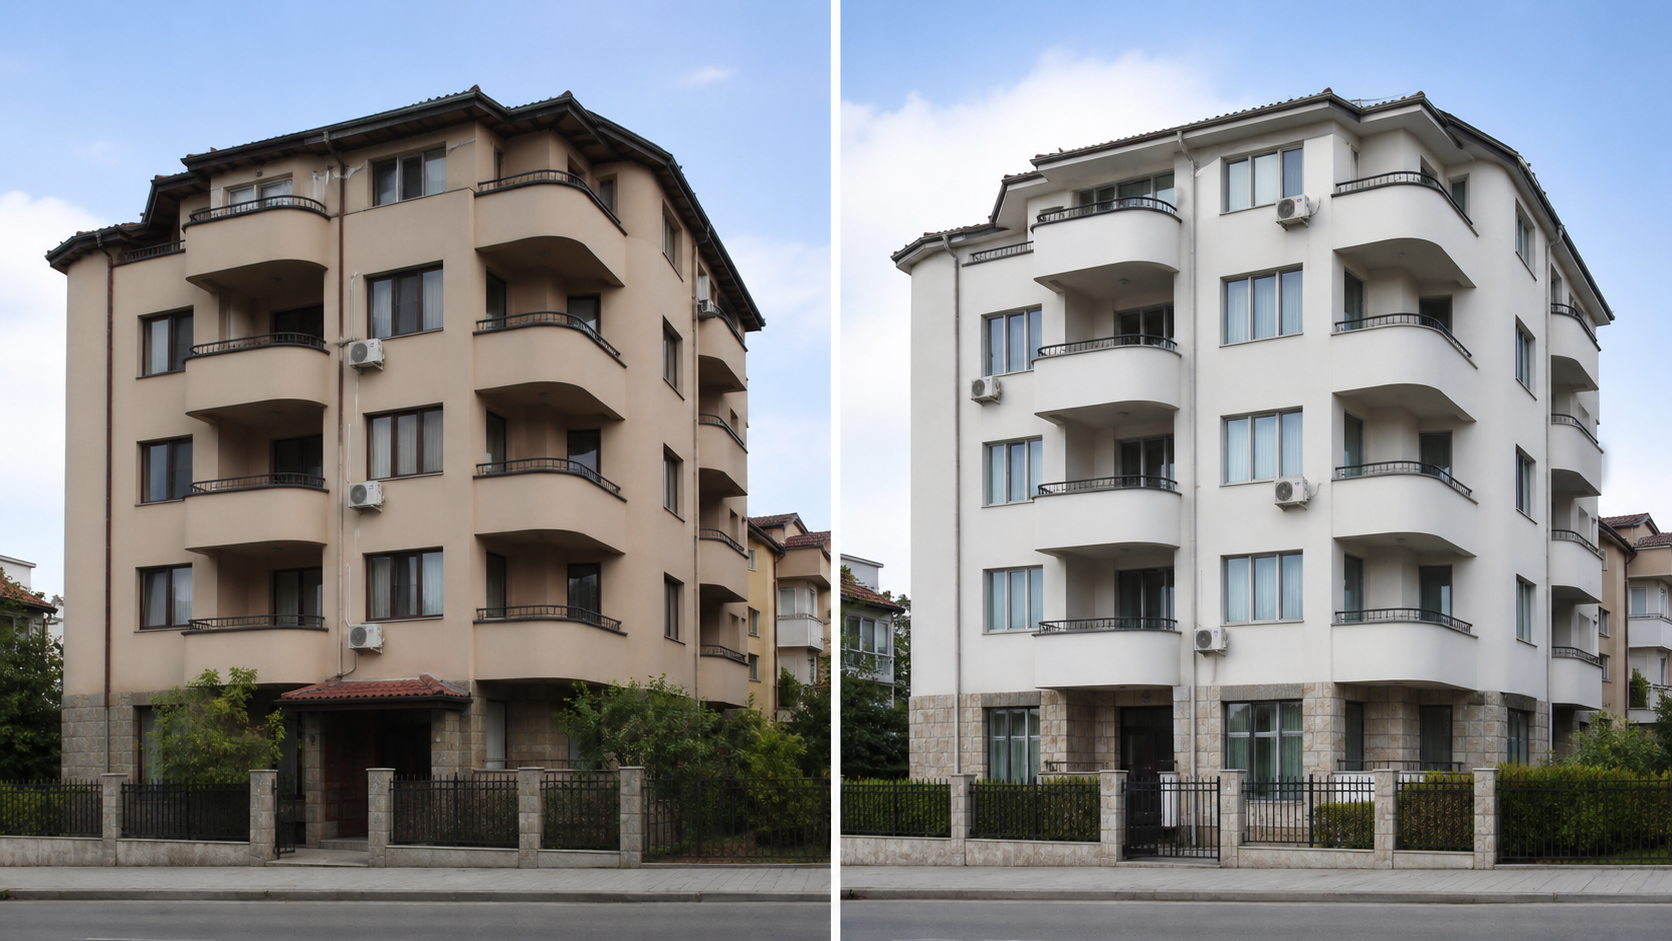
The original page separated studios, apartments of different sizes, coastal houses and mountain property. It also highlighted several cities and resorts. That segmentation is still useful, but only if every current candidate is recorded with the same definitions.
| Comparison field retained from 2018 | Useful internal route | What to record today |
|---|---|---|
| Studio and apartment layouts | Current property catalogue | Room layout, stated area, usable area if available, floor, lift and furnishing |
| Property by the sea | Coastal property | Exact settlement, distance used in the listing, year-round access and building costs |
| Mountain property | Mountain locations | Settlement, access, heating, condition and distance to daily services |
| Large coastal cities | Varna and Burgas | Neighbourhood, building type, condition, observation date and listing status |
| Resort markets | Sunny Beach, Sveti Vlas and Sozopol | Complex, maintenance terms, seasonality, completion and what the price includes |
Build a like-for-like comparison today

Select three to five properties that could genuinely substitute for one another. Capture them on the same day and keep the evidence beside each row. If an important field differs, either exclude the property or explain the difference before drawing a conclusion.
- Place: Record the city, neighbourhood, building and access to the places you use. A city-wide label hides different micro-locations.
- Property: Record the layout, area definition, floor, orientation and common areas. Similar room labels may describe different types of home.
- Condition: Record whether it is new or resale, its completion, furnishing and repairs. A lower asking price may mean that the buyer takes on repairs and other costs.
- Date: Record the capture date, active status and any later price change. Offers from different months are not one current sample.
- Costs: Record the maintenance fee, known building charges and expected repairs. The headline price is only part of ownership cost.
- Terms: Record the payment schedule, included items and seller conditions. Two prices may cover different packages.
Verify the exact object before relying on the comparison
- Confirm that the listing is active and that the stated price and included items are still valid.
- Ask which area definition is used for any price-per-square-metre calculation and keep it beside the figure.
- Inspect the property, building and common areas instead of comparing photographs alone.
- Request up-to-date title, encumbrance and building documents. Ask an independent local lawyer which documents apply to the transaction.
- Record maintenance charges, expected repairs and anything excluded from the sale.
- Compare the asking price with similar active offers. Keep the official index separate as an indicator of market movement.

Once you have defined the comparison, use the current BolgarskiyDom catalogue to collect current comparison listings. For a location-first shortlist, see where to consider buying property in Bulgaria.
Official sources and verification path
The National Statistical Institute housing price statistics is the official entry point for Bulgaria's house price series. The NSI regional house price index table provides the regional data route. Eurostat publishes the comparable quarterly series in its House Price Index dataset.
Use these sources to check index movement and the covered period. Do not turn an index into an asking price for a particular home. For that decision, collect current like-for-like offers and verify the exact object.
Keep the history, rebuild the comparison
The 2018 index is valuable as an early market baseline. Its correct role is historical. Keep the date visible, compare only equivalent properties and verify every live detail. This makes the dated article useful without pretending that 2018 is today.

